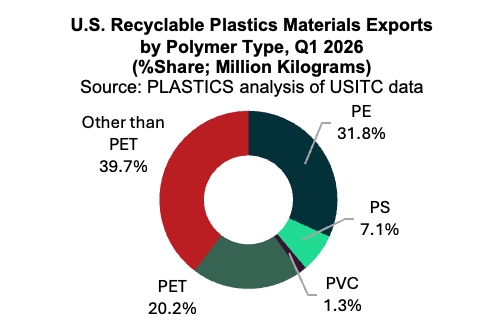
Plastics other than PET and PE dominated trade flows
First-quarter export volumes amounted to 90.5 million kilograms, down 7.7% from the previous quarter and 6.5% year-over-year. By quantity, most U.S. exports consisted of plastics other than PET and polymers of ethylene, accounting for 71.5% of total exports, as shown in the accompanying chart.
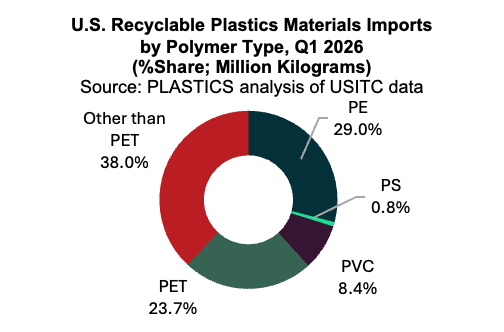
Imports in the first quarter, on the other hand, rose 7.8% quarter-over-quarter to $26.9 million but decreased 60.6% year-over-year (YoY). Import volumes totaled 59.4 million kilograms in the first quarter, increasing 3.5% from the previous quarter but declining 39.2% YoY. Similar to exports, more than half of imports (67%) consisted of plastics other than PET and PE.
Main trade partners in recyclable plastics materials
The main trading partners of the United States in recyclable plastics materials are its USMCA partners: Canada and Mexico. In the first quarter, 37.1% of U.S. exports went to Canada and 17.3% to Mexico, accounting for more than half (54.4%) of total U.S. exports. Together with eight other countries—India, Malaysia, Vietnam, Turkey, Spain, Germany, Pakistan, and El Salvador—these markets comprised 84.0% of total U.S. exports for recyclable plastics materials.
Similarly, most U.S. imports of recyclable plastics materials originated from its USMCA partners, accounting for 61.4% and 22.2%, respectively, or a combined 83.6% of total imports. While the U.S. has largely stopped exporting recyclable plastics materials to China, it continues to import from China. In the first quarter, imports from China totaled 1.3 million kilograms, equivalent to 2.2% of total U.S. imports. Along with USMCA partners and China, imports from Denmark, Vietnam, Germany, Czechia, the U.K., Italy, and Bangladesh brought the combined share of these countries to 97.6% of total U.S. imports.