Simulative Approach for the Load Specific Preform-Optimisation in the Two-Stage Stretch Blow Moulding Process

Biaxial stretch blow moulding is a process for producing a plastic container from a preform or parison that is stretched in both circumferential and axial direction when the preform is blown into its desired container shape [Lee90]. It is well established for the large scale production of high quality PET containers with excellent mechanical and optical properties [THG06]. These properties lead to an increasing market share of stretch blow moulded containers in the field of packaging, resulting in steadily increasing sales.
The studies described in this contribution consider the two-stage stretch blow moulding process. The process is composed of a heating and a forming phase. An injection moulded preform is heated via infra-red radiation and afterwards stretched and blown into a mould [BBOS07]. The share of material costs in the entire process chain, including the injection moulding process of the preforms, is about 70 to 75 percent [Hae07]. Therefore, the reduction of the material offers the largest economic potential. The challenge in minimising the use of material is to ensure that the requirements of the bottle, such as stacking strength, that are decided to a large extent by the wall thickness distribution of the bottle, are met [App05].
The concept of “virtual prototyping” is nowadays well established in the stretch blow moulding industry in order to improve the containers properties during the design phase. In that approach, CAE methods are used to predict the bottles wall thickness distribution for a certain preform and corresponding process parameters for a desired PET-bottle design.
The CAE methods for the prediction of the bottles wall thickness distribution can either be heuristic models or process simulations. The heuristic models calculate a wall thickness distribution of a bottle or a container based on similar ones, which were already manufactured. The advantage of this method is that companies use their experience in the model, but the resulting bottle or container is just an approximation based on manufactured ones. Therefore heuristic models are less accurate in the prediction of designs that are completely different from the ones that are used to calibrate the model. For the prediction of containers with an arbitrary shape, the research in this field is focused on integrative process simulations that consider in case of the two-stage stretch blow moulding process both the heating and the forming phase through the material properties of the preform and material models. These simulations offer the possibility to optimise the initial preform design and the process parameters with iterative optimisation routines for various parameter [Gus01].
Integrative Simulation of two-stage stretch blow moulding process
The investigations described in this article consider the two-stage stretch blow moulding process. The process simulation contains the simulation of the heating and the forming phase. The simulation of the heating phase contains the calculation of the radiation from the ovens emitters on the preform surface and a heat transfer simulation.
Simulation of the heating phase
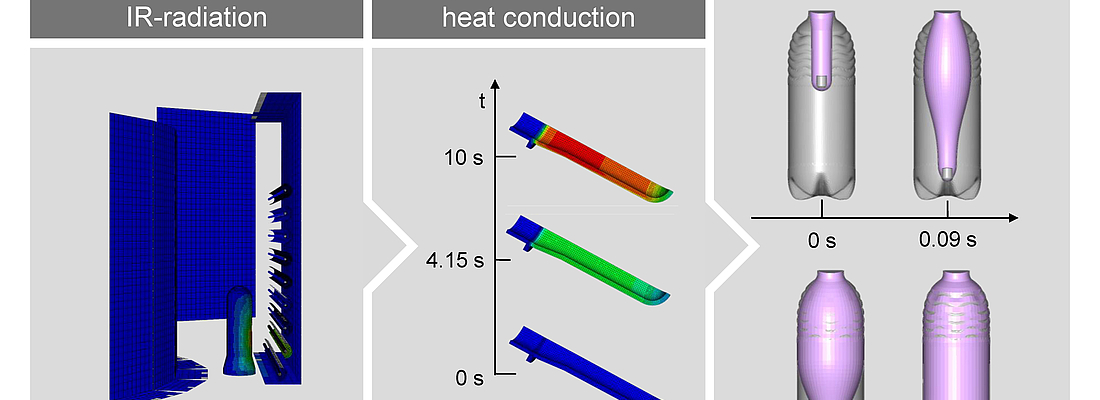
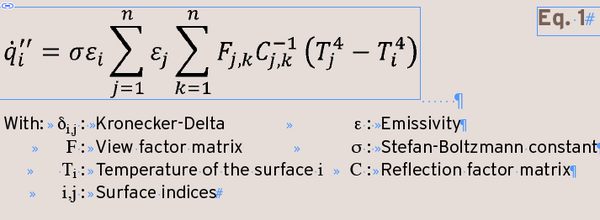
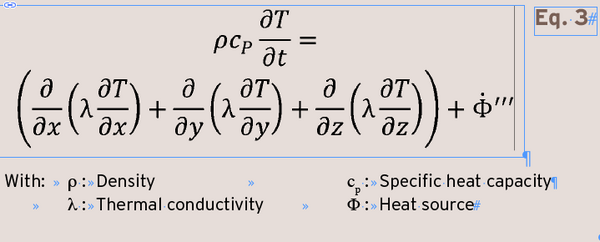
The simulation of the heating phase consists of the calculation of the radiation exchange between oven and preform and the heating of the preform. In the first step, the radiation heat flows on the preform surface are calculated by Eq. 1 with the commercial software Abaqus by Dassault Systèmes, Société anonyme, Vélizy-Villacoublay Cedex in France.
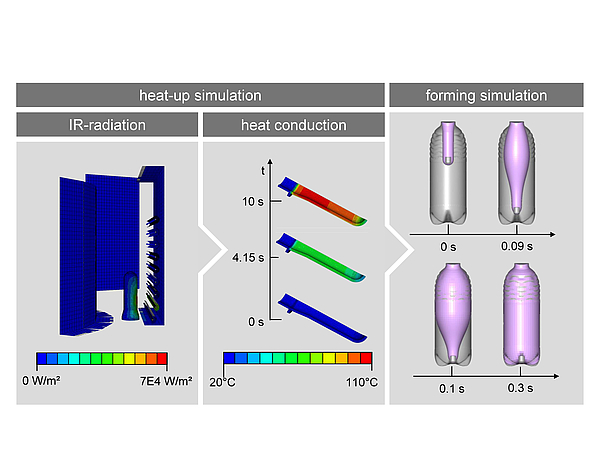
Fig 1: Parts of the integrative process simulation
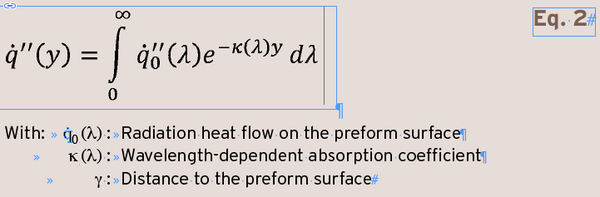
The considered path of rays takes the reflection on the preforms surface and the oven parts into account. The absorption rate of the radiation inside the preform is calculated by the law of Lambert-Bougier in Eq. 2 considering a wavelength dependent transmission spectra.
Eq. 3 was solved through the FE solver in Abaqus / Standard for the preform mesh and results in the temperature distribution of the preform.
Simulation of the forming process
The input provided for the forming simulation is the mesh of the preform, the tool and the stretching rod. The calculated temperature distribution is applied to the preform. The forming process consists of the preform stretching through the rod and the application of pressure on the inner preform surface. The material behaviour is described by a hyperelastic Yeoh model in Eq. 4.
The stretching behaviour of the material is considered isotropic. The coefficients C of the Yeoh model were determined from stress / strain curves. These curves were obtained on extruded PET films in a laboratory stretching machine for the temperatures 90, 100, 110 and 120 ° C and strain rates of 10, 50 and 100% / s.
The result of Eq. 2 is the energy that remains in a certain depth of the preform. That quantity is used to model a heat source for the heat transfer equation in Eq. 3 [Ren02].
Figure 2 shows the resulting wall thickness distribution of the process simulation compared to a the measured wall thickness of PET bottle manufactured at a laboratory stretch blow moulding machine. Both curves agree in the bottles body very well , despite deviations in the neck area and in the bottom of the bottle.
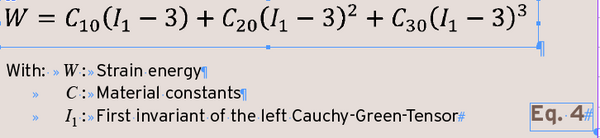
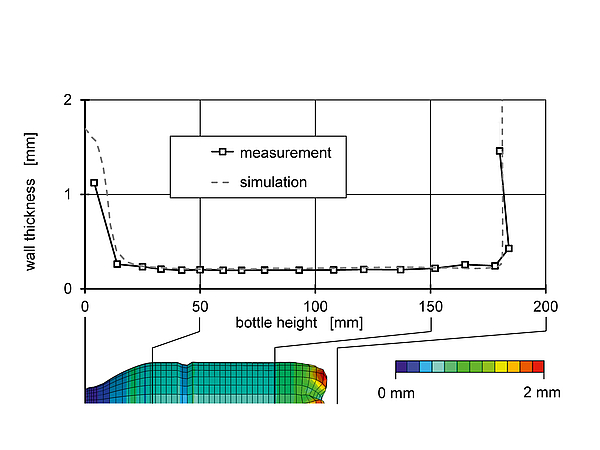
Fig 2: Comparison of the wall thickness distribution calculated with the integrative process simulation and measured and measured values.
Simulation of applied topload to PET-bottles
In a next step, the “virtual prototype” of the bottle resulting from the process simulation is used to analyse the structural stability of the bottle. The structural analysis for the topload calculation is therefore linked to the process simulation as it uses the calculated wall thickness and local stretch ratios [Leo11].
The detailed procedure for the considered topload calculation of PET-bottles is shown in figure 3. First, the stretch ratio dependence of the material is obtained in experimental studies. This data is used along with the wall thickness and the local stretch ratio obtained from the integrative process simulation in the structural analysis of the bottle. The accuracy of the structural simulation depends on the wall thickness distribution of the bottle, the stretch ratios and the material properties.
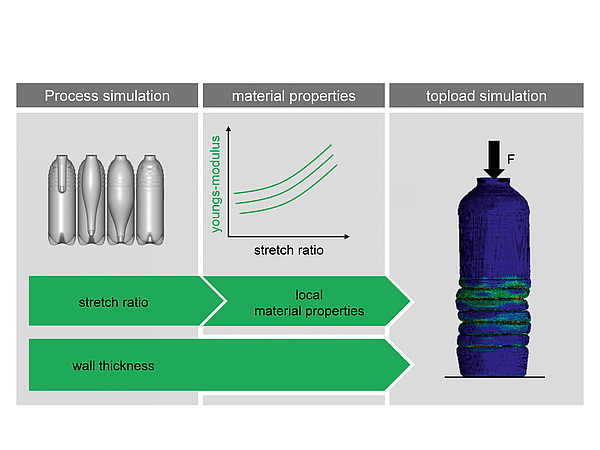
Fig 3: Procedure for calculating the structural behaviour of stretch blow moulded PET-bottles
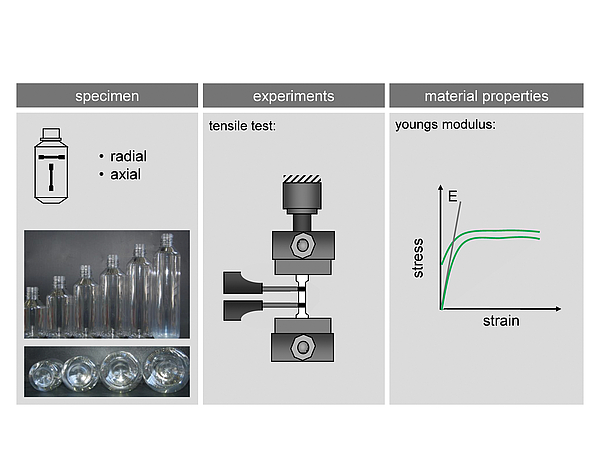
Fig 4: Determination of the stretch ratio dependent material data
Determination of Material Data
The accuracy of the topload simulation depends for the most part on the accuracy of the used material properties, in this case the youngs modulus. The youngs modulus of PET is influenced by the internal structure e.g. the molecular orientation and the degree of crystallinity. Both changes in the forming process due to the stretching of the material and the resulting strain induced crystallisation. Therefore, it is necessary to get material data that takes the process into account.
The procedure for the material data acquisition is shown in figure 4. The specimen for the material data measurements are manufactured in a laboratory stretch blow moulding machine with a modular tool that allows different diameters and heights of bottles that lead to different stretch ratios in the body of bottle. The specimen for the tensile test are cut out in axial and in circumferential direction. The youngs modulus is determined by specimens in tensile tests according to DIN EN ISO 527 [NN96a, NN96b].
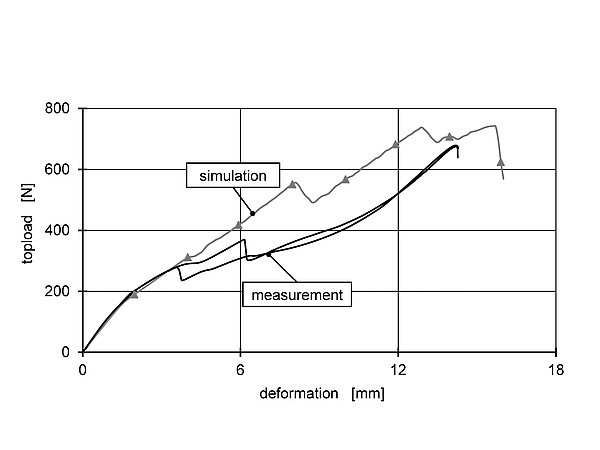
Fig 5: Comparison of the calculated and measured topload curves of a filled PET-bottle [Leo11]
The accuracy of the topload simulation is determined through the calculation of a filled bottle compared to measurements. [Leo11]. Figure 5 shows the result. The simulation describes the time of failure very well, but differences occur in the magnitude of the measured force.
Figure 6 shows the comparison of the bottles deformation under topload between simulation and experiment. The areas of failure concur between the simulation and the experiment and can therefor be predicted well.
Fig 6: Comparison of the bottles deformation under topload between simulation and experiment [Leo 11]
Optimisation of the Bottle wall thick-ness distribution and investigation of the topload behaviour
The described simulations for the stretch blow moulding process and the topload behaviour are now used to optimise the bottle. The optimisation criterion is the bottles weight. The optimisation routine uses the integrative process simulation to get a desired wall thickness distribution by varying the preform geometry and the process parameters. The procedure of the optimisation routine is illustrated in figure 7.
The process simulation consists as mentioned of a heat-up and a forming simulation. This chain has been fully automated to prevent any need of a user interaction. That makes the integration of the process simulation into the optimisation routine possible. The process simulation is performed in each iteration of the optimisation routine and results in a wall thickness distribution for the given preform- and process parameters. This wall thickness distribution is then compared to the desired wall thickness distribution through an objective function.
The objective function in Eq. 5 calculates the square deviation of the desired wall thickness to the calculated wall thickness in each iteration. The square deviation is multiplied with the elements surface to improve the fit of the highly stretched areas.
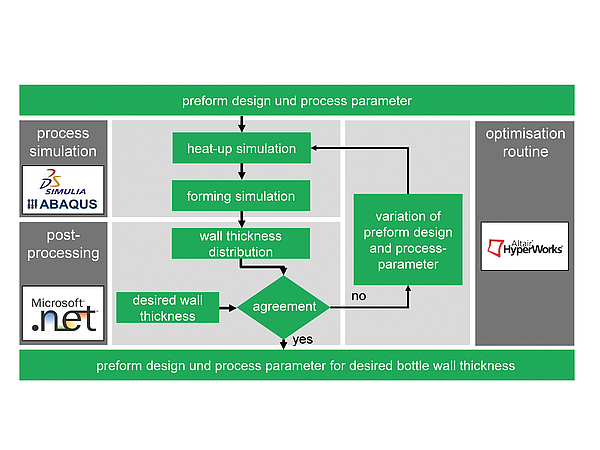
Fig 7: The procedure of the optimization routine
The objective function is a measure for the agreement between the calculated and the desired wall thickness distribution. If the value of the objective function is sufficiently low, the used preform geometry and the process parameters correspond to the desired wall thickness and are used as the result of the optimisation routine.
The preform geometry is defined through the thickness, height and radius of the points shown in figure 8. These parameters are subjected to restrictions of the blow moulding and injection moulding process, e.g. the preform release of the tool in the injection moulding process must
be ensured. Furthermore the stretch ratio is limited in case of the blow moulding process. Another restriction is the electrical power of the IR emitter in the oven of the blow moulding machine, since thermal crystallisation should be prevented.
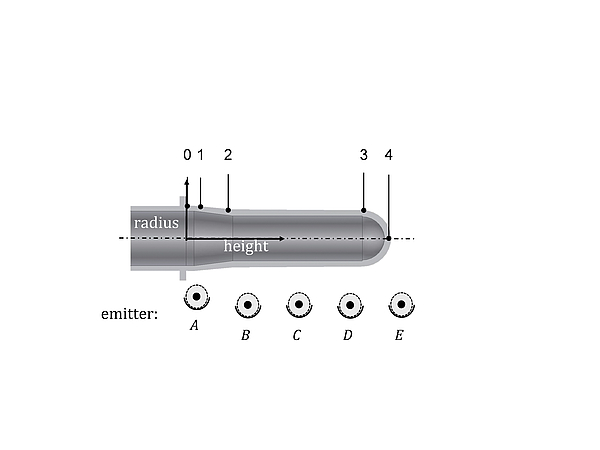
Fig 8: Parameter of the geometry and process optimization
The initial preform geometry used for the optimisation has a weight of 18,5 g. The desired wall thickness corresponds to a preform weight of 15.5g. Figure 9 shows the residual sum of the objective function (Eq. 5) and the resulting preform/bottle weight in each run (one run contains multiple iterations). The residual sum reaches a sufficient low level after a few iterations but in this scope, small variations of the geometry and process parameters lead to large changes in the geometry of the bottle preform/bottle weight. After 139 iterations, small variations lead to small deviations and therefore a robust preform geometry has been found.
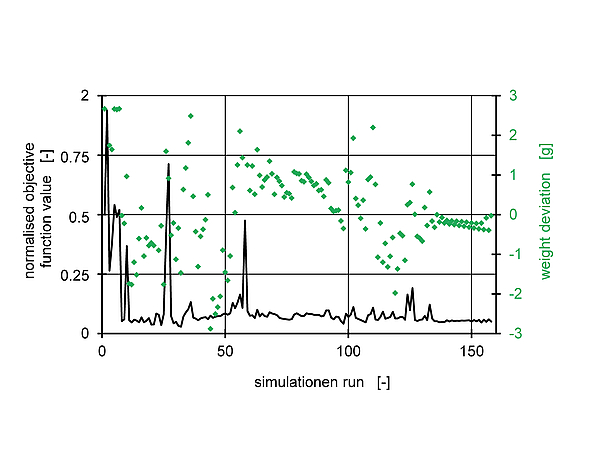
Fig 9: Steps of the geometry and process optimization
The resulting preform was injection moulded and manufactured on a laboratory stretch blow moulding machine. Figure 10 shows the comparison between the following bottle wall thicknesses distributions:
-Simulation: The wall thickness distribution of the process simulation at run 139 of the optimisation routine.
-Target: The desired wall thickness distribution that should be achieved by the optimisation routine.
-Validation: The measured wall thickness distribution with the optimised preform geometry manufactured on the stretch blow moulding machine with the calculated parameters.
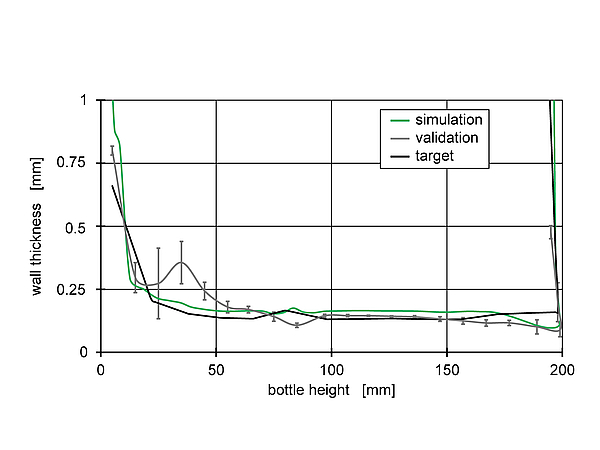
Fig 10: Desired, simulated and measured wall thickness distribution for the preform geometry resulting from the optimisation routine
The target wall thickness concurs to the manufactured bottle in the body (bottle height from 100 mm to 180 mm). Deviations occur in the shoulder of the bottle. The reason for these deviations might the complex preform geometry that leads to errors in the heat-up simulation. Figure 11 shows the preform geometry which has a large change in the diameter between the body and the neck of the preform compared to the initial preform in run 1. If the power of emitter A (figure 8) is in the stretch blow moulding machine slightly higher than in the simulation, the wall thickness of the manufactured bottle fits the simulation. In summary, the stretch blow moulding process simulation embedded in an optimisation routine is capable of predicting a preform geometry and process parameters, with a few adjustments, to fit a desired wall thickness distribution.
Since the prediction of preform geometry and process parameters to fit a desired wall thickness of a bottle was successful, the next target is to embed the combined process and topload simulation in the optimisation routine to improve the mechanical properties of the bottle. As a first step, a process and topload simulation with preform geometries from various runs of the optimisation routine in figure 9 was performed. Figure 11 shows the used preforms from run 1, 24, 60, 90 and 139 with its weight.
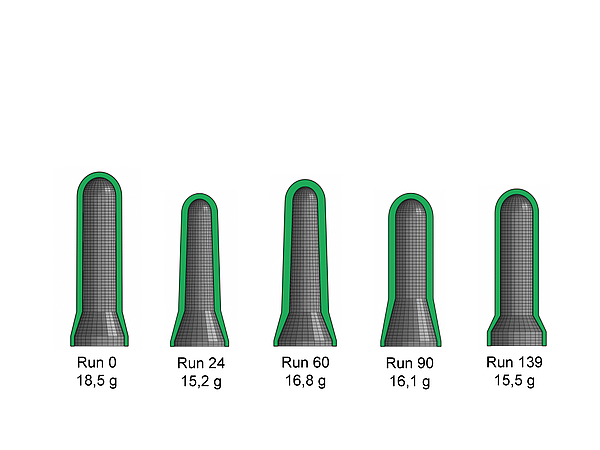
Fig 11: Preform geometries from various runs of the optimisation routine
The simulated stacking strength for bottles made from these preforms is shown in figure 12. The graph shows that there are huge differences in the load capacity of the bottle resulting from the different wall thickness distribution. The lightest preform with 15.2g holds a higher load then the input preform with 18.5 g. The load capacity of the optimized preform (run 139) is almost as good as the load capacity of the initial preform.
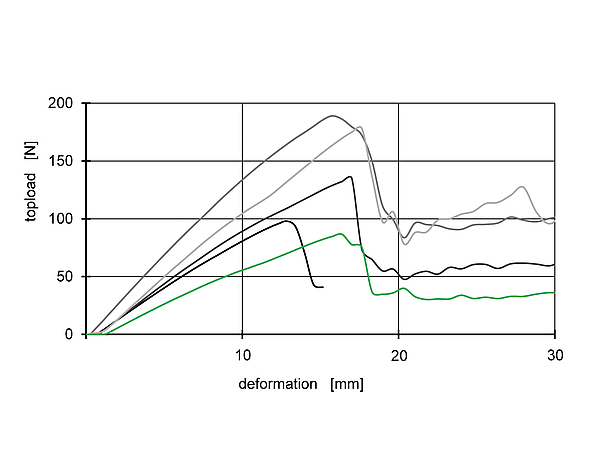
Fig 12: Topload behaviour of the considered preforms
Summary and Outlook
In general, the integrative process simulation and the topload simulation provide good results compared to experimental validation. The process simulation was automated and embedded in an optimisation routine to get a preform geometry and process parameters for a desired wall thickness distribution. The next step is to expand the simulation chain to use a certain topload, sideload and O2-barrier of a bottle as optimisation criteria.
Special thanks
The research project 16257 N and 17323 N of the Forschungsvereinigung Kunststoffverarbeitung at the RWTH Aachen was sponsored as part of the “Industrielle Gemeinschaftsforschung und -entwicklung (IGF)” by the German Bundesministerium für Wirtschaft und Energie (BMWi) due to an enactment of the German Bundestag through the AiF. We would like to extend our thanks to all organizations mentioned.
The comPETence center provides your organisation with a dynamic, cost effective way to promote your products and services.

magazine
Find our premium articles, interviews, reports and more
in 3 issues in 2026.
