In Part 1 of “Total Process Control” (comPETence ONE:15) we discussed the challenges of optimizing the re-heat stretch cold blow molding process with the current quality processing paradigms. The hot mold process, though very different at the molecular level, is similar to the cold mold process when it comes to optimization. As with the cold mold process, the difficulties in managing the hot mold process can be seen in two areas. First, the sampling paradigms are too slow for the process variation
and second, even when sampling at faster rates, measuring the wrong parameter will provide little process information to act on. In Part 2 of “Total Process Control” we will discuss how the hot mold process can be monitored off-line using chemometric analysis techniques and controlled on-line by managing the on-set of haze on the container.
The Hot Mold Process
(Similar but Different)
In Part 1 of this article we established that proper energy levels and distribution in the preform are critical to blowing a good cold mold container. In the hot mold process this is also true. There is a difference however between the two processes. Although molecular orientation, or crystallinity, is critical in the cold mold process, it plays a diminished role in the hot process. In the cold mold process the mold serves to lock in the bi-axial orientation and cut off any residual spherulitic crystal growth. When properly done, a strong pressure vessel with acceptable permeability characteristics is created. In the hot mold process the preform may be processed at higher temperatures allowing the formation of spherulites to become the dominant molecular characteristic. The optimal amount of spherulitic, or crystallinity, growth depends on the processing temperature, the dwell time at temperature, the amount and rate of stretching, and finally the temperature of the mold. The hot mold locks in the spherulitic crystal growth, and when properly done, a strong dimensionally stable container capable of withstanding a hot fill without deforming is created. Managing either process has its own unique problems. The following discussion will explore some of the challenges with the hot mold process.
Hotter is Better
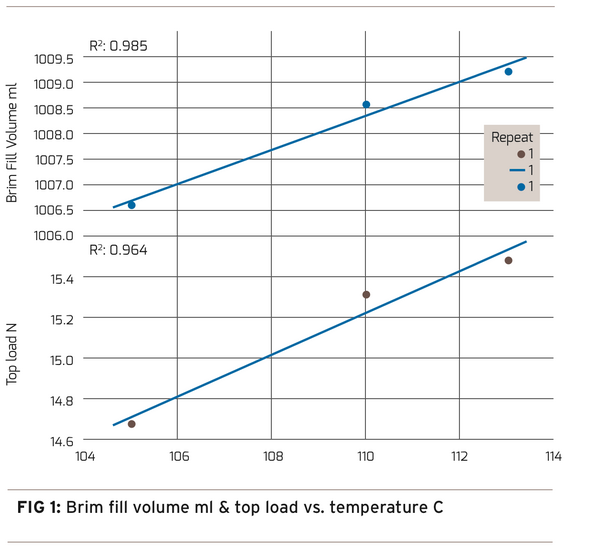
Consistent with the cold mold process evolution, anecdotal information has driven process engineers to push the hot mold process hotter. The results as measured using current methods showed better mold fill factor, dimensional stability, and an overall better container. The difficulty with the hot process can be summed up as “the hotter the better but not too hot”. Overheating the preform produces excess spherulites that can render a good performing container opaque and unusable. Figure 1 shows the improvement in brim fill and top load with increased preform stretching temperature.
The ideal scenario is to manage external and internal process variation to maintain a constant preform temperature at the edge of opacity. This ultimately will provide the best performing container with the desired visual clarity. There are several different approaches to establish how close the process is to the edge of opacity. One can choose to measure the level of spherulitic crystallinity or simply measure the amount of haze present in the container. First, let’s look at a direct measurement of crystallinity.
Using Chemometrics to Understand the Hot Mold
Making a direct spherulitic crystallinity measurement on the production line can be a technically difficult and an expensive proposition, however, a laboratory direct measurement is feasible. In the following discussion we will review a Near Infrared (NIR) spectroscopic method of measuring the transmission characteristics of spherulitic crystallinity in PET containers followed by a chemometric analysis to create a predictive temperature model.
Hot Mold DOE
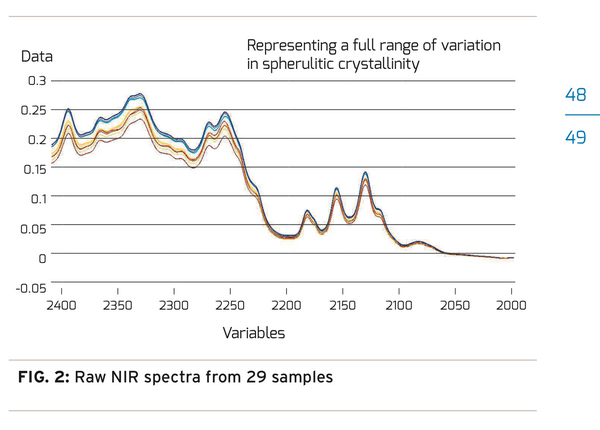
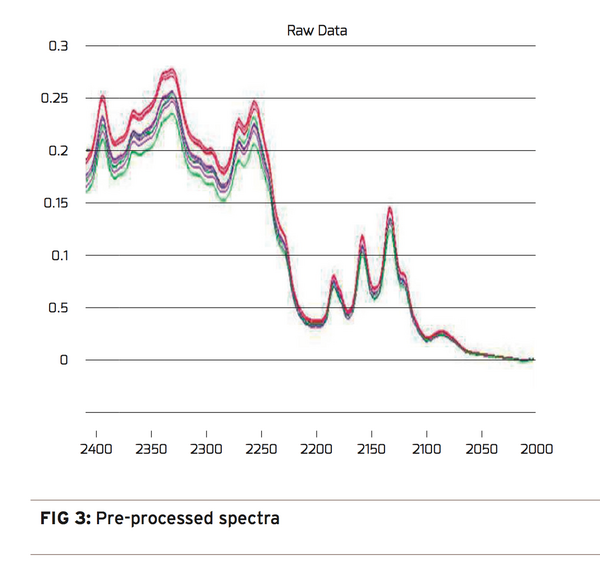
A hot mold Design of Experiment (DOE) was conducted that adjusted processing temperatures from the low and high temperature processing extremes. The results ranged from containers well into the haze region or nearing opaque to perfectly clear containers with little structural integrity. From the DOE, 29 container samples were selected representing low, medium, and high processing temperatures. The 29 containers were prepared and measured using NIR transmission spectroscopy. Figure 2 shows the raw spectral data from all 29 samples. Each sample group with the same level of crystallinity has been color coded for easy identification. With a preliminary review, one can almost see 3 defined groups of spectra. Unfortunately, it’s not that easy. The thermal and crystallinity information contained in the spectra cannot be extracted without a chemometric analysis. Chemometric analysis is a way to extract information from spectra to identify groups with similar characteristics. We used it to study the variations in the NIR crystalline spectra. To conduct this analysis it is important to know the infrared signature of PET. Vibrational overtones and combinational stretching modes originating in the C-H and O-H groups of the Ethylene glycol and Terephthalic acid are the signature to look for. They can be found in the spectra between 2000nm and 2400nm. The first step in the analysis is to isolate the variation in the spectra that is due to the change in crystallinity. To accomplish this, systematic errors in the spectra must be removed. The pre-processing step removes “baseline shifts”, “light scattering”, and “indeterminate path length” errors from the data. The details of these techniques are beyond the scope of this discussion.
Pre-Processing
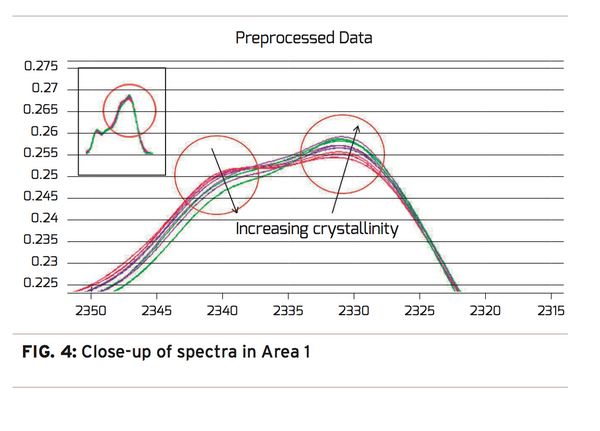
The pre-processing results in Figure 3 show a dramatic change in the spectra when comparing the original spectra on the left to the pre-processed spectra on the right. With the pre-processing complete, the majority of the remaining variation in the spectra will be due to the change in crystallinity or processing temperature. A short investigation of the spectra reveals variation in Areas 1 and 2. With a closer look at Area 1, Figure 4, one can see a potential correlation with crystallinity color groups showing transmission decreasing at 2340nm and increasing at 2330nm as crystallinity increases.
Principal Component Analysis
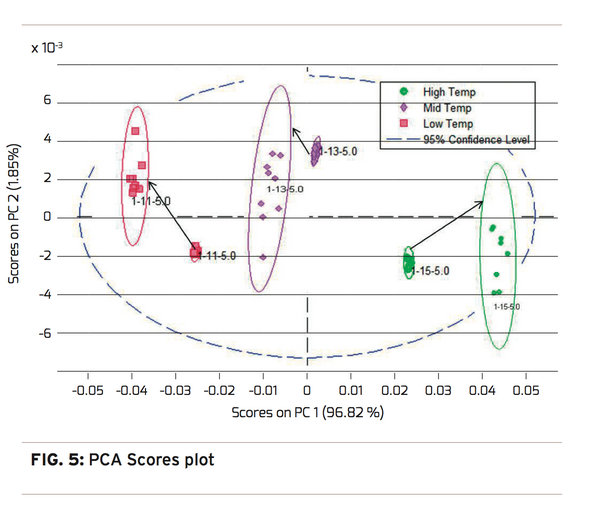
With this potential correlation identified, the next step is to perform a Principal Components Analysis (PCA). The PCA is a validation step that attempts to mathematically explain the variation in the spectra that is caused by an independent function. In this case, processing temperature was used since it is highly correlated with spherulitic crystallinity. The desired result is for the groupings of preform stretching temperatures and the spectral variation to be highly correlated, and the results explained in as few Principal Components as possible. The PCA results can be observed in a scores plot, Figure 5. The scores plot shows good clustering by processing temperature. This can be inferred by observing no mixtures of colors in the clustered groups, no outliers for each of the color groups, and all three cluster groups fall within the 95 % confidence level. Finally,
98.76% of the spectral variation can be determined with two Principle Components. PC1 determines 96.82% in the X axis and PC2 determines 1.85% in the Y axis. This scores plot provides sufficient confidence that a valid model can be created to predict processing temperature using a Partial Least Squares (PLS) analysis.
Creating a Model
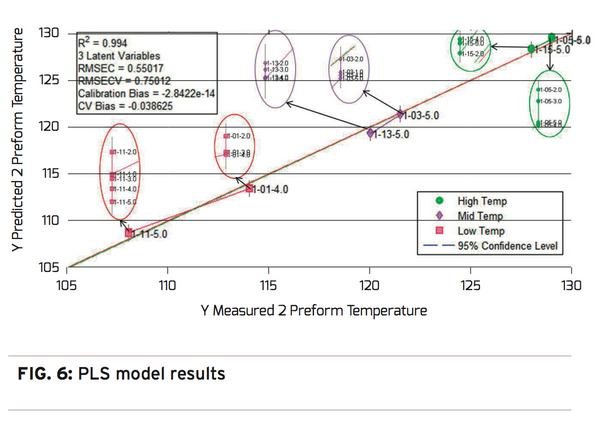
The PLS analysis is conducted on the same spectral data and the associated measured temperature data used in the PC analysis. The analysis creates a predictive model for preform stretching temperature based on measured variation in the observed spectra. Reviewing the data in Figure 6, shows that the actual measured preform stretching temperature is highly correlated to the predicted stretching temperature with an R2 value of 0.994 and an RMSECV or prediction precision of 0.750 degrees C. Using a NIR/PLS model to predict preforms stretching temperatures and therefore the crystallinity levels provides a highly correlated nondestructive laboratory technique to measure container performance. While the direct NIR/Chemometric analysis technique provides very accurate results, the implementation scope of this solution is best suited for the laboratory.
On-set of Haze
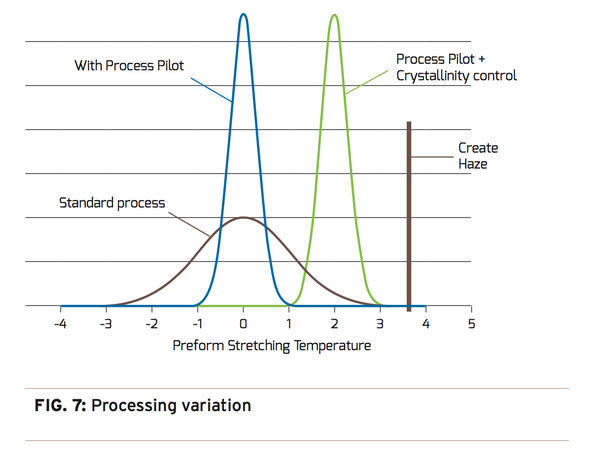
A more practical approach to managing crystallinity in hot mold processed containers is by visually detecting the on-set of haze. This can be accomplished in real-time by using sophisticated vision image analysis to perform on-line haze measurements. With this approach, it is not only possible to monitor crystallinity, but also control it. Similar to a cold mold process where processing at the edge of “too cold” provides the best performing container, processing a hot mold process at the edge of “too hot” (Figure 7) provides the best performing container.
Practical Application
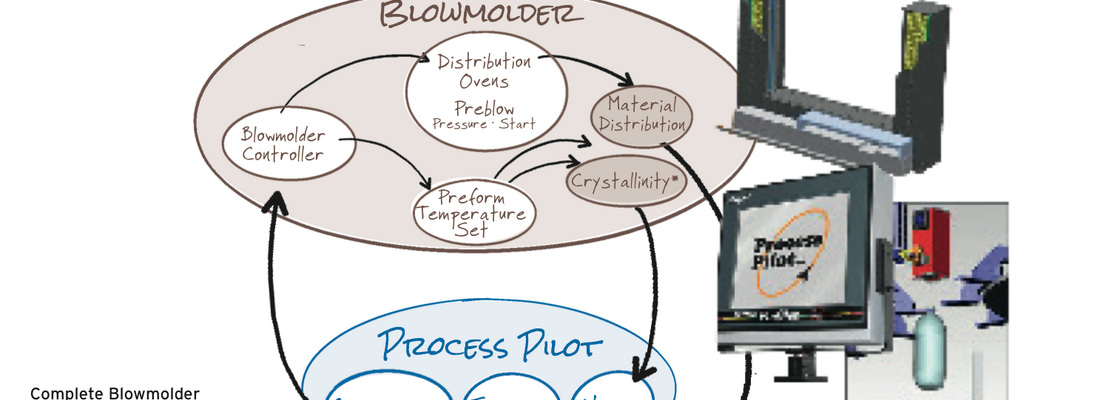
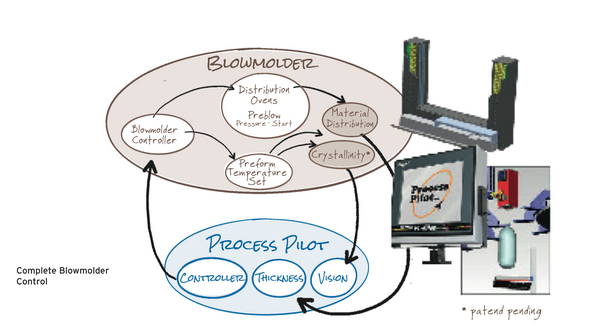
As a result of our extensive studies, experiments, and knowledge base on this subject, we were able to develop CrystalView™, which works in conjunction with the blowmolder to monitor and manage crystallinity. The CrystalView™ product is a high-precision, camera-based solution that can detect and control/optimize haze before the human eye can see it. Combining this capability with Agr’s Process Pilot® material distribution control provides un-matched processing stability for leading blowmolder platform. Agr’s Process Pilot® blowmolder management system precisely controls and maintains material distribution. The combination of CrystalView™ and Process Pilot® provides the capability to fine tune and control the process by optimizing crystallinity and maintaining material distribution throughout a production run. The Process Pilot® family is, and will continue to be, a valuable processing tool that facilitates the on-going push to light weight containers and reduce energy consumption.
Conclusion
In summary, advancements in re-heat stretch blowmolding present several challenges in optimizing the process and continue to drive the demand for automated process control. Agr International, Inc. is uniquely positioned with the Process Pilot® suite of products to meet and exceed industry needs.
The comPETence center provides your organisation with a dynamic, cost effective way to promote your products and services.

magazine
Find our premium articles, interviews, reports and more
in 3 issues in 2026.
