For a long time quality inspection just meant: sorting out bad parts. When the first vision inspection systems inspected plastic packages in the 1990’s, the upmost goal was to find the defective ones. But it soon turned out that this was not the whole task: A high “false alarm rate” could easily make the systems expensive and lead to a lower productivity as they would also reject parts without recognizable errors which could still have been sold easily. Especially when decisions were made upon a thin data base the amount of falsely rejected articles could go up to several percent. The conclusion drawn for vision inspections was the same as in real life: The more raw data one has the better decisions can be made. While in the 1990’s computational power and the resolution of cameras were limited, today a well-designed vision system can easily handle the data of dozens of color cameras with megapixel resolution.
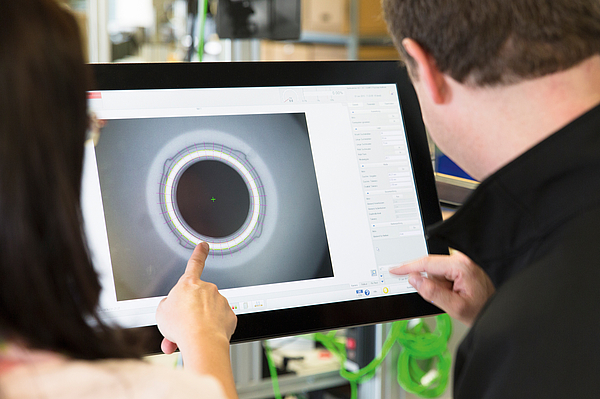
FIG. 1: Defects on single objects are shown on the display greatly enlarged
Already very early operators of injection molding, stretch blow molding or extrusion blow molding machines became interested in what ended up in the reject bin. Carefully they analyzed the defects of the waste products, looked to cavity numbers and drew their conclusions. With the know-how of their long professional career they interpreted the defects and translated them into counter measures to re-establish a high line productivity.
On-screen statistics
To save operators from diving into the reject bin extensive statistics came to human-machine-interfaces of the vision inspection systems. They tell machine operators which defects occur how often and when. Beside bare columns of figures, easy-to-read diagrams give information how the reject rate has developed over the last time, how the variance of different object dimensions look like or what the most prominent defect is.
A significant step forward in the aim to correct for a non-optimal production as fast as possible was the implementation of optical character recognition (OCR) technologies into the inspection systems. With this technology it became possible to let the machine read cavity numbers. Since then defect statistics have become cavity number oriented. This enables operators not only to see which defect occurs most often, but also from which cavity it is caused. With triple-digit cavity molds this is a significant advantage. From that point on defects could be easily traced back to the nozzle of a single cavity by just standing in front of the monitor of the vision inspection system.
FIG. 2: Faulty objects are thrown out automatically
Early alarms
With more and more lines done by just a single operator the tool to control the quality statistic needs to become more powerful. It needs to show more production lines at a glance and give early alarms so an upcoming defect can be corrected before it develops into a problem for the production plant. Moreover, it needs to be within a portable device for the operator, wherever he or she is. At the same time a comprehensive quality management tool is the right basis to document the production quality over a long period. By doing so, for instance a preform-producer can consistently substantiate the quality of each and every production lot to his customers. He can even show pictures of products produced months ago. With this vast amount of data it is also possible to detect trends which would not be visible in a daily statistic. Based on these data warehouse analyses, the maintenance of a mold can be predicted well ahead of the high season as well as, for example, the efficiency of different molding parameter setups can be compared. Of course it is also an appropriate instrument to see all relevant parameters of all production lines worldwide in real-time like on the conning bridge of an ocean liner. Using this tool, for instance a multinational closure producer would be informed anytime about the produced amounts and the actual efficiencies of all its lines worldwide.
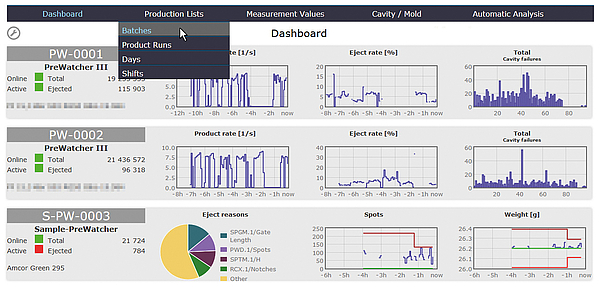
FIG. 3: The dashboard menu of the IntraVisualizer shows the current status of the production, including a eject reason analysis
Visualizing error statistics
A tool to meet these needs is the IntraVisualizer by Intravis, a leading German producer of vision inspection systems. To use it, the producer only needs to connect a server to his inspection system. It is a strong software that edits and visualizes the performance data of the entire production. Being designed for a self-explanatory use, it does not require long trainings. An intensive development phase has resulted in an easy-to-use software interface. The tool turns all relevant characteristic production numbers into significant visual diagrams. The IntraVisualizer is also usable with a touchscreen as interface, allowing to be used on a portable tablet device. By a click, one can choose the monitored value – like ovality, surface, notches and others. It is also possible to track single measurement readings. The user can set up the display according to his needs by adding or changing systems. It is also possible to add certain defects like cavity faults.
The IntraVisualizer receives all needed data of several systems in one production facility from the server that collects it. When the software accesses the data base, it can visualize different time periods like shifts, days, free date ranges and also batches. The user receives instant answers to his questions: What is the production rate, what are the cavity faults and what are the main reasons for ejections?
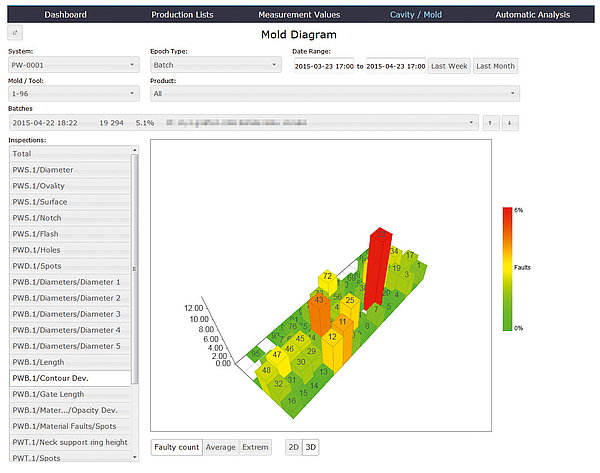
FIG. 4: The mold diagram shows the performance of the single cavity mold in 3D
Trend statistics
Moreover, the software comprises a trend statistic that prevents the production from producing too many waste objects by a series of malproduction. To activate it, values within a non-error deviation range from the reference value for certain production parameters have to be defined. During production the software observes these production parameters and analyses trends. As soon as a trend stabilizes and may lead to a fault deviation within a certain period of time, it shows this trend on the screen or even generates an e-mail to the operator automatically. The operator now has the opportunity to correct the parameters again. In this regard, production errors are corrected before they really occur in the form of fault products, saving material and maintaining a high productivity.
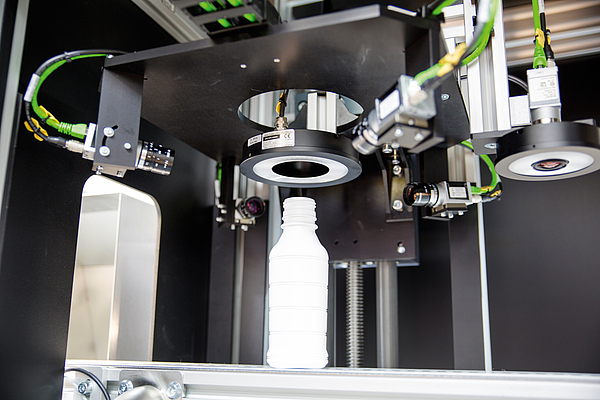
FIG. 5: Cameras from different angles deliver an inspection all around
Mold diagrams
The IntraVisualizer is also able to generate mold diagrams to let the operator observe the error rate of the cavity and single molds. To do so, the user can choose a product, time period, product run and molds on the interface and hereinafter within seconds receive a diagram about which production molds deliver a reliable performance. It shows the entire cavity or single molds, as a 2D or even 3D diagram, including the statistics of the total number of objects, incomplete evaluation and faulty objects.
With this comprehensive knowledge about the actual performance of the production line it is an obvious idea to close the loop and improve the production quality automatically.
Read in the next issue of comPETence how Industry 4.0 combines vision inspection systems with the knowledge based control of production machines to form a new generation of ultra-stable, self-adjusting machines.
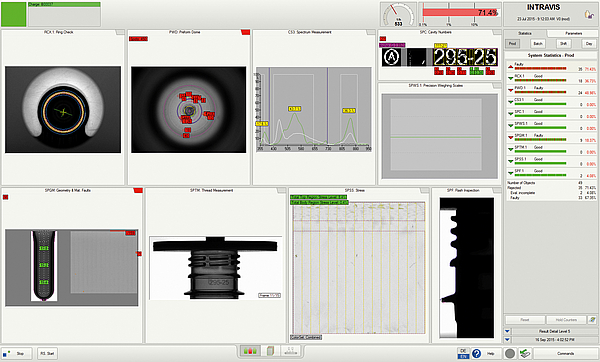
FIG. 6: Intravis inspection systems detect multiple defects on any inspected object by different inspection modules
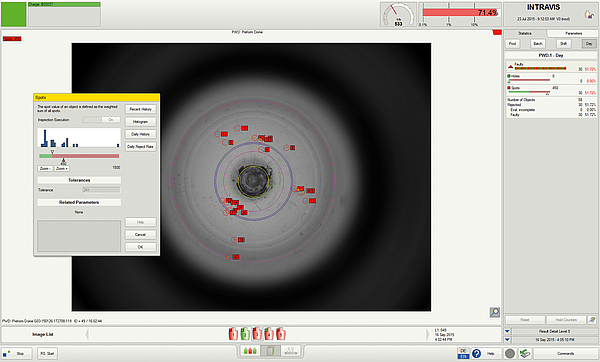
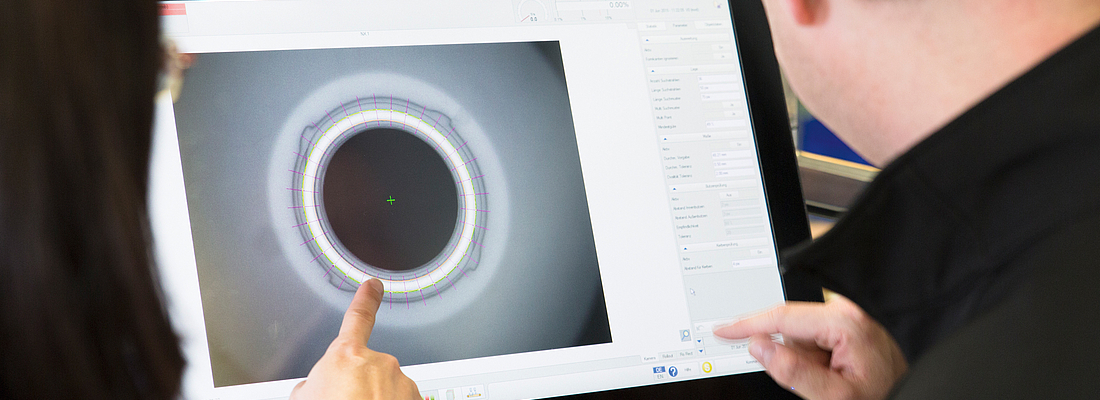
FIG. 7: The settings can be adjusted by the operator and require a training
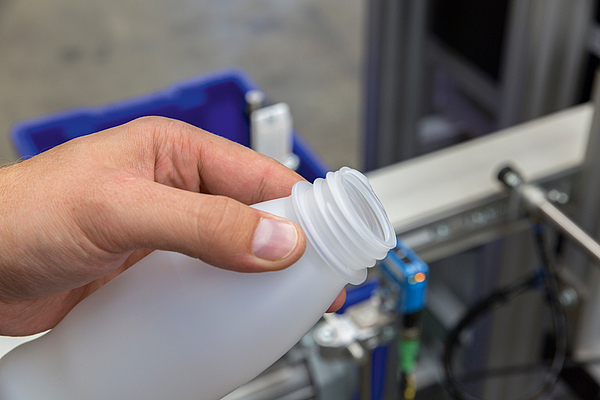
FIG. 8: A manual check of the objects in the ejection bin reveals the defects
The comPETence center provides your organisation with a dynamic, cost effective way to promote your products and services.
magazine
Find our premium articles, interviews, reports and more
in 3 issues in 2026.
