

This article details the importance of understanding a PET bottle’s mechanical properties, particularly with the continued developments in Lightweighting, Recycled PET and Barrier Technology. It demonstrates how the data from a standard burst test can be used to explore stress-strain curves, fracture point, elastic & plastic regions, Young’s modulus and intrinsic viscosity to gain a more detailed overview of the finished bottle.
Lightweighting, Recycled PET and
Barrier Technology
PET is predominantly used in the manufacture of plastic bottles. It is relatively strong yet flexible with low permeability providing a suitable and cost-effective packaging solution. During production it is important to understand the capabilities and limitations of the finished bottle design to ensure it is fit for purpose, with particular emphasis on the bottle’s mechanical properties. These properties are vital for ensuring the bottle maintains structural integrity during its lifecycle.
With the rise in different manufacturing requirements, such as Lightweighting, Recycled PET and Barrier Technology it has never been more important to physically verify the bottle’s performance.
Lightweighting is always a key area to save material costs, and due to recent advances in technology and design, there has been a heightened focus in this area. Inevitably as a bottle is lightweighted the wall thickness decreases and its strength is reduced.
In the environmentally conscious society we live in, the use of recycled PET as a sustainable material is encouraged and as such is often used as a copolymer with virgin PET.
Barrier technology within PET bottles has been another area of recent intense interest, with the addition of extra material at the injection moulding stage to prevent infrared, UV, oxygen and water ingress/emittance.
Each of the manufacturing techniques detailed can have unknown effects on mechanical performance, with bottle integrity requiring reverification. While tensile and compressive testing can be carried out on preforms and thin PET sheets, these do not replicate the final bottle in its application and ignore any changes or defects that may occur during the blow moulding stage.
Burst testing provides a real and physical representation of how the bottle performs under stress and what its limitations are. Furthermore, advanced analysis of the resultant data can provide a more detailed overview of the bottle’s mechanical performance and material properties.
Basic Burst Testing
An industry standard test to determine a bottle’s bursting point. The bottle is filled and primed before the pressure is increased at a controlled ramp rate, resulting in a corresponding volume increase, until the bottle bursts, as depicted in Figure 1.
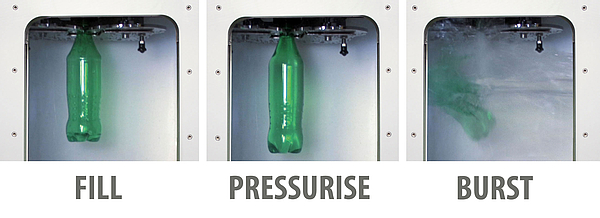
Fig. 1: Bottle Burst sequence of Fill, Pressurise, Burst
Typically, pressure and volume are both plotted against time to graphically represent the bottle expansion and burst, see Figure 2. Measured features include Burst Pressure and Volume Expansion.
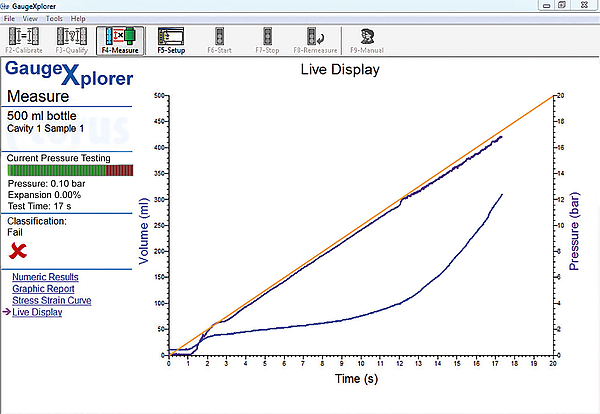
Fig. 2: Typical results graph from a standard burst test
Advanced Burst Testing
A number of important features can be identified by analysing the data obtained from the controlled burst test, to give an indication of the mechanical properties of the finished bottle.
Stress-Strain Curve
Stress is used to express the force acting upon a body and is defined by:
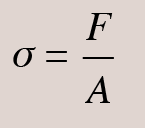
Where F is the force applied and A is the cross sectional area of the body.
Strain is the amount of extension of the body in the direction of the applied force and is defined by:
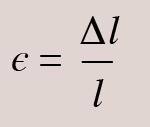
Where Lamda is the original length of the body and DeltaLamda is the extension of the body in the direction of the force.
Looking at the definitions of stress and strain it can be seen that there is a link between these and the values measured during a burst test. Stress is defined as a force divided by an area, which also defines a pressure so this can be substituted for the pressure applied during the test. The strain is defined as a change in length divided by the original length which can be substituted by volume expansion over original volume, or a percentage volume expansion. Plotting applied pressure (bar) against volume expansion (%) produces an indicative stress-strain curve, see Figure 3.
The resulting stress-strain curve provides the necessary information to determine key material properties. A generic stress-strain curve is shown in Figure 4.
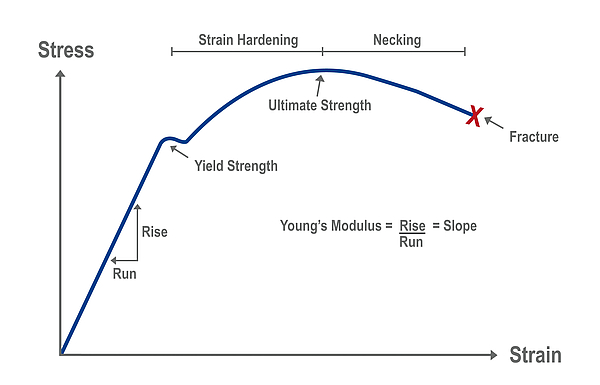
Fig. 3: Indicative Stress-Strain curve for a burst bottle
Fracture Point
The point at which a sample catastrophically fails, typically resulting in a break in the material. It is also where the measurements cease at the endpoint of the curve in Figure 4. Any damage to a sample, or irregularities in the composition of the material may lead to a premature fracture.
When applied to finished bottles, the fracture point directly corresponds to the burst point. Any defects during manufacture may cause a premature split in the body or base causing an early burst. Low burst pressures can signify a process problem or an issue with preform design. Inspecting and comparing a number of bottles after bursting is an easy way to identify a defected part. If the burst pressure is higher than required this may allow the product to be lightweighted, reducing material costs.
Elastic & Plastic Regions
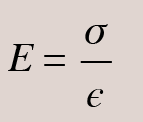
Ductile materials, such as plastics/polymers, have two distinct regions on their respective stress-strain curves. The elastic region is the initial linear gradient of the curve and represents the area where the material would return to its original size and shape if the stress is removed. The gradient of this elastic region is defined as the Young’s modulus (E) of the material and is calculated by:
Fig. 4: Typical stress-strain curve for a ductile material
The latter section of the curve is where permanent deformation takes place and is known as the plastic region. Once plastic deformation occurs, the sample will not return to its original size and shape when the stress is removed.
Yield Point
Defined as the stress at which the deformation of a material becomes irreversible. Beyond this point the material begins to rapidly stretch with continuous addition of stress. For finished bottles, this can be identified on a volume expansion graph as the point at which the gradient of the slope begins to rapidly increase, as shown in Figure 2.
An indicative yield point can be found by analysing the recorded volume data. This is done by locating the change in gradient of the volume expansion curve and performing a least squares linear regression on both regions of the curve to find the intersection point. This process is shown graphically in Figure 5.
The yield point indicates a bottle’s resilience and its ability to absorb impact energy if dropped or damaged during transportation. Additionally, two supposedly identical bottles could have the same burst point, but one may yield earlier and have a larger expansion volume. This signifies a potential problem during injection moulding which could have affected the molecular weight.
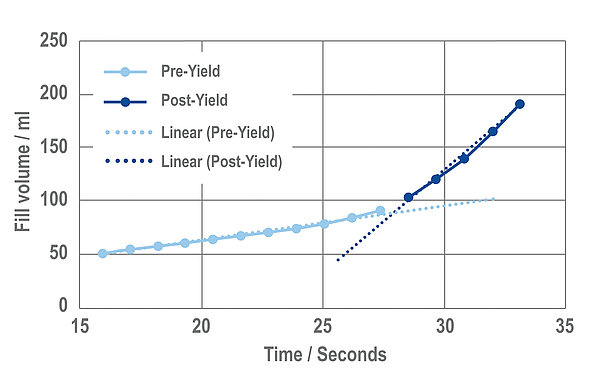
Fig. 5: Finding the intersection points on a volume time graph
Intrinsic Viscosity (IV)
IV defines the average molecular chain length of a polymer and is therefore a measure of its molecular weight. This reflects properties such as tensile strength and crystallinity. It is important to realise however that many other aspects influence the mechanical properties; the amount of any copolymer added is one of these factors.
The expansion volume between the yield point and burst point is related to the IV of the polymer. A higher IV corresponds to a smaller post-yield expansion, and conversely a lower IV corresponds to a larger post-yield expansion. This is due to higher molecular weight polymers reaching the strain hardening point sooner, therefore the yield point is reached later. Figure 6 shows how the IV value can be interpreted from a graph of volume expansion versus time. However, a change in IV value should not be assumed by a change in the yield point, as material composition and process parameters will also affect this property.
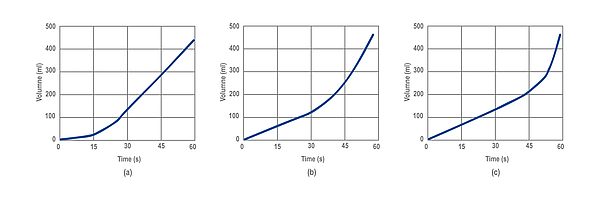
Fig. 6: How inherent viscosity affects yield point and volume expansion
The Complete Solution
A considerably more detailed overview of a bottle’s mechanical performance can be achieved by analysing each of the properties previously mentioned; taking bottle testing beyond single burst point measurement.
Torus’ B303 Burst Gauge, see Figure 7 offers this functionality in a robust and user-friendly design. Bottles are loaded individually into custom location discs. Once secured the burst routine can start behind a locked, waterproof safety door, providing a controlled test environment. A user-definable test procedure is performed and live graphs are updated on screen. Additional numerical and graphical results are displayed when the test is complete.
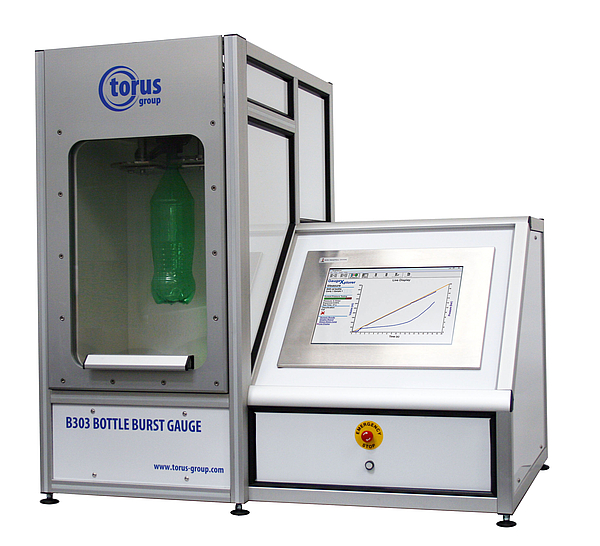
Fig. 7: Torus’ B303 Bottle Burst Gauge
Examples of the user-definable test modes include Burst Mode & Hold Mode.
Burst mode is the simplest of the modes available within the gauge software. A pressure ramp rate can be set by the user along with a maximum pressure, or it can be selected to ramp until burst. This can be used to find all of the mechanical properties described in this article, highlighting the pressure and volume at both yield and burst points along with data describing the volume expansion.
Hold mode allows holds to be added into the tests in order to replicate states the bottle will endure during its lifecycle. Up to three holds and their relative durations can be set at user defined pressures, see Figure 8.
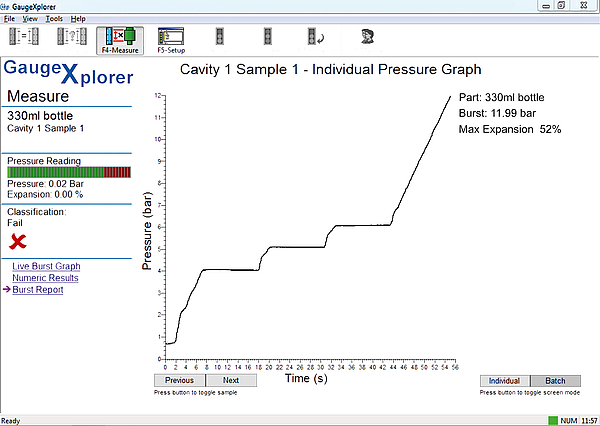
Fig. 8: Pressure Hold Graph
New PET Aerosol Testing
Furthermore, Torus Measurement Systems have a newly developed high pressure burst gauge designed for testing more robust PET aerosol bottles. The gauge holds all the capabilities of the current B303 gauge with the added benefit of testing up to pressures of 40 bar, doubling the current gauge limit.
The comPETence center provides your organisation with a dynamic, cost effective way to promote your products and services.
magazine
Find our premium articles, interviews, reports and more
in 3 issues in 2026.
