
Quantitative measurement of residual stresses for PET Preforms and bottles offers new hope for our old nemesis – stress cracking
This article summarizes a study of a high precision quantitative stress measurement technology from Polaritek Systems Inc., a member of the Advanced Technology Development Center at Georgia Tech in Atlanta, GA, that offers hope for improving our capability to implement effective process control for stress crack resistance at the preform and bottle manufacturing stages.
It’s been thirty-seven years since those first one-piece 2-Liter PET bottles began popping from stress cracking. There has been a lot of progress to mitigate the factors that exacerbate stress crack failures. However, it pops up its ugly head sometimes unexpectedly. An important reason is the dearth of data on the factors that contribute to stress crack failures available to the processor for effective preform and bottle manufacturing process control.
Material distribution, IV, morphology, and stresses developed during injection and blowing molding determine the stress crack resistance of containers. The processor typically has only had material distribution data to guide him or her. Measuring material distribution is useful, non-destructive and fast but tells an incomplete, sometimes misleading story. Should the base be thicker or thinner? It depends on what making it thicker or thinner does to the morphology and the residual stresses. Measurement of IV and morphology is difficult and too slow to be practical for process control. Traditional measurement of stress in preforms and bottles with a cross-polarizer isn’t quantitative, is imprecise and subject to misinterpretation. Directly testing bottles for stress crack resistance with the traditional ISBT test method with caustic solution is imprecise, often too late and provides little information on the cause of low stress crack resistance.
The PET container industry has been able to measure stress in preforms and containers since their introduction in 1977. The problem has been that the typical cross-polarization technique used is qualitative and subjective. Measurement precision error with cross-polarizers is too great to be useful (figure 1). Cross-polarizers don’t separate out what are called isoclinics and isochromatics. Isochromatics are those visual clues that reflect the magnitude of stress while isoclinics reflect direction. The isoclinics obscure and confuse the analysis of the important isochromatics. The Polaritek technology studied here separates out the isoclinics so that the isochromatics are fully revealed and quantifiable using recently developed image processing algorithms. This allows the creation of colorized stress maps which can be easily interpreted.
To study the potential of the Polaritek technology for quality and process control, we measured residual stresses in preforms and bottles from a series of statistically designed experiments (DOEs) that we conducted with a major manufacturer to improve stress crack resistance for PET preform and container manufacturing. We analyzed the results for correlations between the stress measurements and results from the ISBT stress crack resistance tests. We also analyzed for statistically significant effects of injection and blow molding process variables on the stress measurements to evaluate the potential for process control and completed a sensitivity analysis for the effects of process variables on stress and, in turn, stress on stress crack resistance.
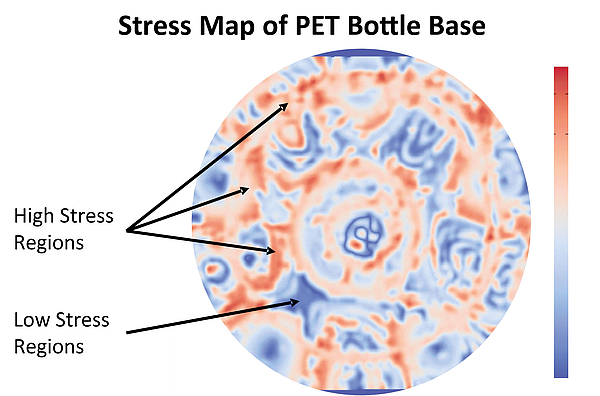
FIG. 1: Stress map fo bottle base
The results are very promising. There were highly statistically significant correlations between stress measurements and stress crack resistance test results indicating good potential for application to quality control. There were clear and statistically significant effects of injection and blow molding process variables on the stress measurements on preforms and bottles indicating that the stress measurements could be valuable for injection and blow molding optimization and control.
The stress measurements that correlated best with stress crack resistance were maximum stress in the container base and the distance between the injection gate and a characteristic biaxial stress point. Below is an illustration of the stress measurement process and measurements from this study (figure 2).
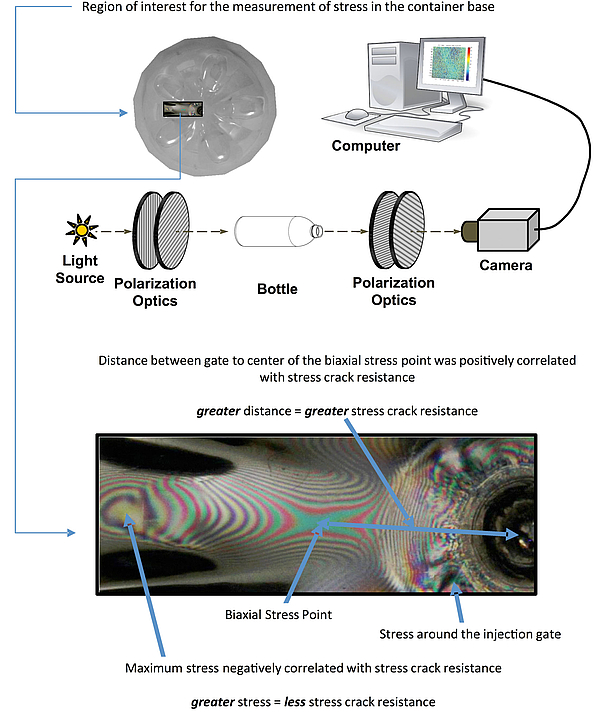
FIG. 2: The stress measurement process
Correlations between stress and stress crack resistance test results were statistically significant at the 99% confidence level. The regression plots (figure 3) compare correlations with stress crack resistance for four cases: (1) base thickness; (2) max stress; (3) max stress plus distance measured from gate to the biaxial stress point; (4) max stress plus distance measured from gate to the biaxial stress point plus base thickness. Correlation with base thickness wasn’t statistically significant. Correlations for each of the other three cases were statistically significant at the 99% confidence level. The R2 values, which indicate the percent of variation in the stress crack test results explained by the independent variable(s): (1) = 5%; (2) = 45%; (3) = 55%; (4) = 59%. It is likely that much of the additional variation is due to manufacturing process variation. We would expect higher R2 values if we had been able to test the same containers for stress as that we tested from stress crack resistance.
Injection and blow molding variables effects for preform and bottle stress measurements were statistically significant from the 90% to 99.9% confidence levels indicating that the stress measurements are sufficiently precise for process optimization and control.
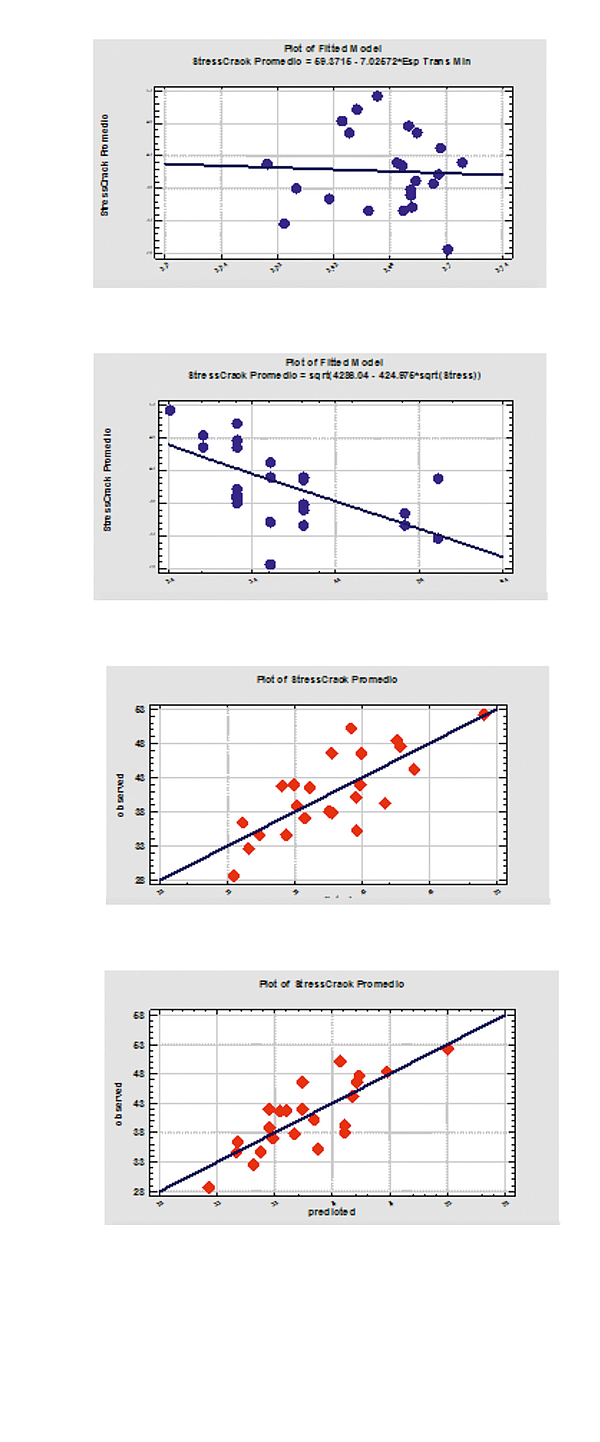
FIG. 3: The correlations with stress crack resistance
The blow molding interaction plots (figure 4) show the similarity of effects for stress crack resistance and the stress measurements. The combinations of process factors that result in the min stress and the max distance between the gate and biaxial stress point are the same as those that result in the max stress crack resistance as indicated with the green circles. Note how differently the preforms (green line = optimized injection process, red line = original injection process) behaved for different injection molding configurations suggesting the importance of injection process control to an effective strategy to optimize stress crack resistance.
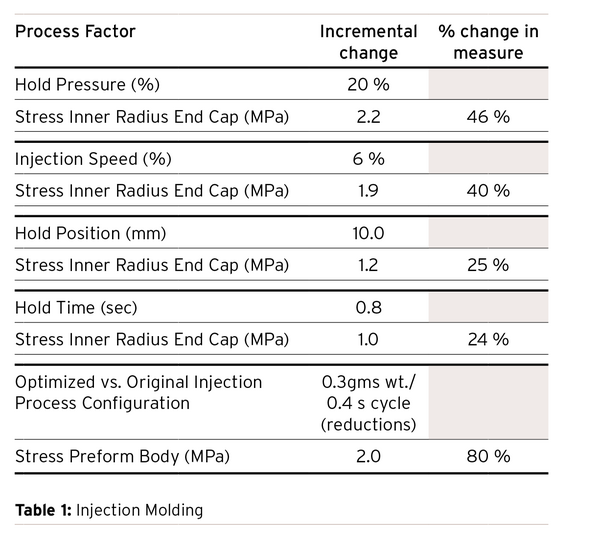
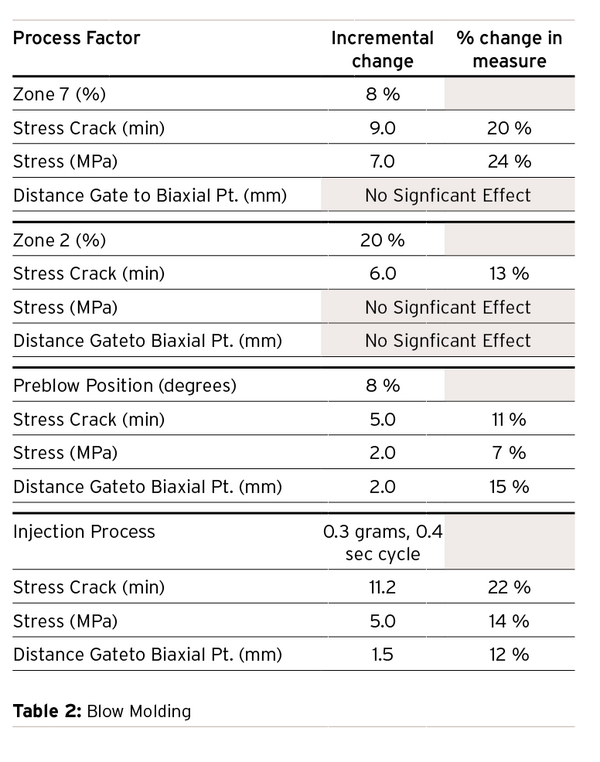
The tables below summarize the sensitivity of stress measurements and container stress crack resistance to process variables.
For the process variable ranges studied in the DOEs, the largest effect on stress crack resistance was the injection process configuration from which the preforms were molded. A change from the injection process that enabled the best stress crack results back to the original process with 0.3 gm increased preform weight and a 0.4 sec increased cycle would result in an 11 min reduction in stress crack resistance before re-optimizing the blow molding process configuration, a 5 MPa (14%) increase in container base stress and a 1.5 mm (12%) decrease in distance from the gate to the biaxial stress point. The same changes in the injection process produced an incremental change in preform residual stress of 2 MPa change (46%) in preform stress. The table shows the sensitivity of preform stress to the individual injection process variables.
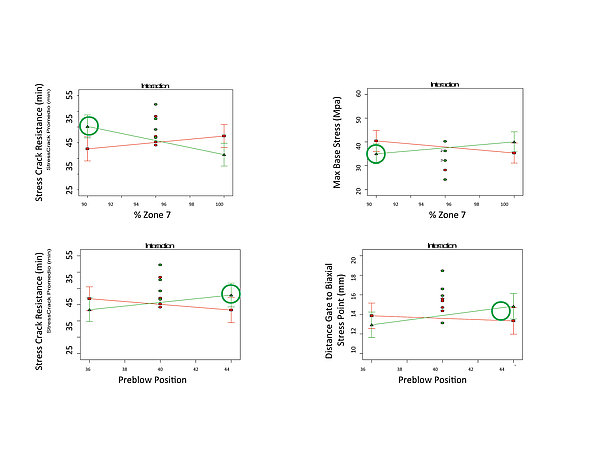
FIG. 4: The blow molding interaction
Conclusion
In summary, there appears to be good reason for optimism that, after thirty-seven years, we may finally be on to something that will enable real process control for stress crack resistance. If the good news keeps coming about the value of the technology, the Holy Grail for quality and process control may be within reach. The inventors at Polaritek are confident in the possibility to develop the method for real-time on line stress measurement.
This article focuses on measurement of stresses in the context of stress crack failures. However, since stress is related to the morphology, IV and defects, the greater value may be in monitoring stress measurements for statistically significant changes in those key material variables as a means of injection and blow molding process control with broader relevance than just stress crack resistance. The research into the utility of stress measurement will continue. Let’s keep our fingers crossed for a future with a more controlled PET container manufacturing process world.
The comPETence center provides your organisation with a dynamic, cost effective way to promote your products and services.
magazine
Find our premium articles, interviews, reports and more
in 3 issues in 2026.
