
New regulations and corporate commitments are increasing the focus on sustainability in the PET bottle market. Recycled PET (rPET) material is the main focus in the race to meet these commitments and regulations. And beverage bottles are the prime target. To complicate matters, the rules of the game continue to change. Increasingly aggressive sustainability goals have pressured beverage selfmanufacturers to move from manufacturing bottles using only virgin PET to producing these same bottles with a significant percentage of rPET.
The 2019 EU SUP Directive, Article 6, sets out a target for manufacturers to use 25% recycled content in PET beverage bottles by 2025 and 30% in all plastic beverage bottles by 2030. Most recently, the U.S. Plastics Pact Roadmap requires that signatories agree to produce all of their PET bottles with an average of 30% recycled or responsibly sourced biobased content by 2025.
All of the major brand owners have made public commitments to use increasing levels of rPET in their bottles, some have committed to as much as 100% rPET on key SKU’s and have set targets to achieve greater than 50% rPET content for the entire portfolio within the next 2-3 years and 100% by 2030.
Not as easy as one might think
Virgin PET material, with its controlled production and defined, and documented lineage has minimal variability and is quite predictable in its performance when it comes to producing PET bottles. Recycled PET is another story altogether. Supply chain issues, the source and past life of the recycled materials, contaminants and molecular inconsistency are but a few of the issues, and all contribute to rPET variability. Whether it is blended on site or pre-blended, every pound of rPET material will have a different composition.
One of the most common challenges to optimum blowmolder performance is the lack of consistency in the preform supply. When dealing with a high percentage of rPET the potential for variability in the preform supply is even greater. This variability presents great challenges to process engineers as bottles become increasingly difficult to make. Even the most experienced operators are challenged with trying to manage a consistent process when rPET is being used.
When uniformity is no more
Given that blowmolding is a process where uniformity is key to stability, the additional preform inconsistencies associated with rPET can affect blowmolder operation and produce out-of-spec, poor quality bottles that severely disrupt downstream production.
Typically, when using 100% virgin resin from a single source, variability is minimal. However, even with minimal variability related to the resin, dynamics like temperature, humidity, preform quality, machine condition, or even operator skill can impact material distribution, the key factor in bottle performance. When you add rPET to the mix, the stability once taken for granted with virgin resin is no more. Uniformity is compromised and there is a whole new level of variability and unpredictability added to the blowing process.
Significant cosmetic and processing challenges introduced by rPET must be addressed to produce quality bottles and maintain an efficient process. To effectively deal with this, a go-no-go vision inspection alone is not sufficient. A two-fold approach is required that includes a combination of visual inspection to address contamination and visual defects, and a pro-active process management system to manage process variability, while maintaining production efficiency.
Visual defects
One complication of rPET usage is the presence of black specs, foreign material and unmelts. As the amount of rPET increases, the potential for contaminants present in preforms is increased as well. Color consistency is also a significant issue. In addition to cosmetics, bottle performance can be challenged by the presence of these contaminants and color variations.
A vision-based inspection system employed in the blowmolder offers the most efficient method to detect rPET related defects. Inspecting preforms is essential as well as that of the blown bottle as defects are more concentrated in the small size of the preform and can be seen much easier. Inspection at this stage can reduce the occurrence of blowouts when huge contaminants are present and save energy by not blowing bad bottles. Further, the concentrated view of the cameras on the preform sidewall permits detection of much smaller particles and defects. Color variations are also easier to identify in the preform state. To address these issues, the blowmolder should be outfitted with a high quality, multi-camera vision system that can identify cosmetic defects in preforms and bottles during the blowing process. It should also have the ability to provide color inspection of preforms entering the blowmolder to ensure that colors are consistent and within acceptable ranges. Agr’s Pilot Vision+ system provides the capability to learn multiple references for color inspection and eliminate preforms that fall outside the range of the reference colors. This allows the color inspection to accept a mixture of preforms from multiple rPET sources while maintaining tight tolerances.
Processing rPET
Because of the inherent variability of rPET, there may be significant differences in the process between 100% virgin (vPET) and an rPET mix. One of the major variables attributed to rPET preforms is color inconsistency. To compensate for inherent yellowing of resin as a result of re-processing, varying percentages of toner or carbon black is added to cover this yellowing. The addition of toner and the amount used directly affects the heat absorption rate of the preform. A compounding factor is that the amount of toner and the consistency within and between preform batches can vary significantly, causing an unstable production process.
These inconsistencies in color and material properties associated with rPET preforms can cause the process to move outside the processing window without warning, affecting material distribution and bottle performance.
Base defects are also a common occurrence with rPET. Though impurities and contaminants are responsible for some base defects, they are not responsible for all. The inherent variability of rPET resin itself can cause processing issues that lead to inconsistent material distribution resulting in more baserelated defects than with virgin materials. These subtle changes in base appearance due to process variations can be a major source of vision defects.
For the most part, a good vision system with base inspection can identify visual defects related to impurities and rPET process variability. However, the reject rate will be significantly higher than with virgin PET and potentially at a level that is unacceptable for many operations.
The increased reject rate can be dealt with in two ways. One way is by opening the limits on the vision system. This can be effective in reducing rejects but can allow poorer quality bottles to move downstream with material distribution issues that could impact the smooth flow of bottles down the line as well as filling, labeling and packing operations. The second, preferred approach is to remove variability by stabilizing the process and maintaining it while visually inspecting for random defects. This approach offers a means to reduce scrap and improve overall bottle quality.
Addressing processing issues
Continuous monitoring, testing of bottles for proper material distribution and proactive management of the blow molder is necessary to avoid the production of defective or poorly performing bottles in downstream operations. Even with the best operations using virgin material, this can be quite challenging as well as labor intensive. When dealing with rPET content, the usual variables that are reasonably predictable to the blowmolder and its environment are compounded by random variability imposed by the rPET material. Even with the best blowmolding systems, manual intervention with the blowmolder controls is not efficient nor practical when dealing with the random variability of rPET. Especially with high production systems, the process can quickly get out of control, producing thousands of poorquality bottles before an operator can make the proper adjustments to bring the process back to an acceptable level. This is where real-time measurement and automated blowmolder control can provide a great advantage.
To better understand the difference between processing vPET vs. rPET, and the value of automated blowmolder control, a study was performed that captured material distribution data from production lines where bottles were manufactured from preforms composed of 100% vPET and, alternately, preforms of 50% rPET content. The data used for comparison was captured from several beverage facilities that selfmanufactured PET bottles. This data included production from multiple lines of similar bottles produced with and without automated blowmolder control.
Methodology
Material distribution data for each example was captured from multiple production lines and production runs of like bottles. All bottles were of similar size and weight. Each production line was outfitted with the Agr Pilot Profiler® online distribution measurement system and Process Pilot® automated blowmolder management system to collect data for this study. In order to avoid single line and operator bias, the data captured was averaged across multiple lines from several plants to create a sampling that is relevant to a wide population.
The data captured is displayed in several comparative graphs. The graphs provide a material distribution profile of the bottle utilizing data captured at 13 equally spaced (12.7 mm) locations over the bottle sidewall. Points on the graph represent the standard deviation (a change in thickness, as % of wall thickness at the sensor location) /1/.
Example A- 100% vPET – no automated control
The first example represents the average material distribution for several production runs of similar 500ml bottles using preforms manufactured with 100% virgin material. Prior to production, blowmolder recipes were optimized for the bottle size and weight. In this example, material distribution was monitored by both routine section weight analysis and in-line thickness measurement on every bottle. Adjustments for distribution changes were made manually as necessary by the processing staffs on all lines without the aid of automated controls.
In this example (Figure 1, Graph A), material distribution over the bottle sidewall is relatively consistent. The standard deviation at each sensor location ranged between 1.21 and 3.71, an overall range of ~2.5.
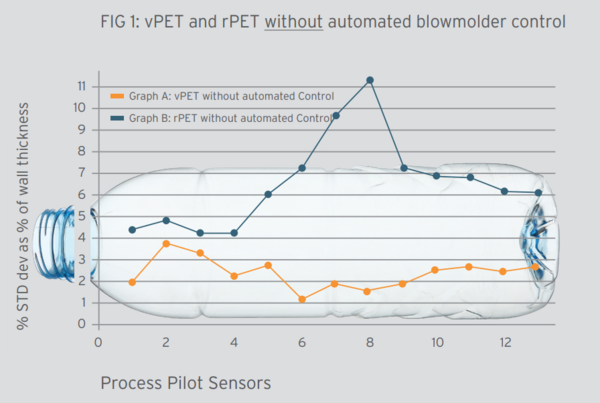
Example B - 50% rPET – no automated control
In this example, production using 50% rPET preforms was monitored. The data represents the average material distribution for several production runs of similar 500ml bottles. Prior to production, blowmolder recipes were optimized for the bottle size and weight. Material distribution was monitored by both routine section weight analysis and in-line thickness measurement on every bottle. As in the first example, adjustments for distribution changes were made manually as necessary by the processing staffs.
This example (Figure 1, Graph B) illustrates the variability in material distribution over the bottle sidewall common with 50% or greater rPET content. In this example, the standard deviation at each sensor location varied between 4.2 to 11.3, an overall range of ~7.1. Not only is the range between measurement points significant but the overall variation at each sensor is substantial. Managing distribution with this amount of variation can be quite challenging. As the amount of rPET increases, the amount of process variability increases with it.
When comparing both examples in Figure 1, you can see the difference in process variation between the 100% vPET and the 50% rPET bottles.
Automated controls make a difference
The following examples again show both the production of bottles with 100% vPET and 50% rPET material. However, in this case the Agr Process Pilot automated blowmolder control was turned on and used to pro-actively manage the blowmolder.
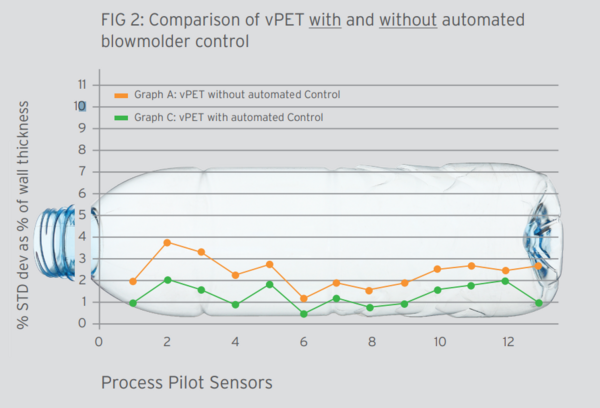
Example C - 100% vPET - automated blowmolder control
This example represents production runs on similar 500 ml bottle types using preforms manufactured with 100% vPET material but instead of manual control of the blowmolder, control was managed by the Agr Process Pilot automated blowmolder control system. As with example 1, prior to production, the blowmolder recipe was optimized for the bottle size and weight and the bottle distribution baseline was established prior to initiating the Process Pilot system.
Although the vPET study using manual control showed relatively consistent material distribution, production with automated blowmolder control represented a much tighter process and less deviation (Figure 2, Graph C) in material thickness. The standard deviation, using automated control to manage the blowmolder ranged between 0.44 to 1.97, an overall range of ~1.5. When comparing to the manual operation of blowmolders producing the same bottles, there is notable improvement in distribution control. See Figure 2 for comparison of production with and without the Process Pilot automated blowmolder control.
For the virgin material, with the control of the blowmolder managed by the Agr system, you can see the overall material distribution is more consistent resulting in a tighter, more controlled process.
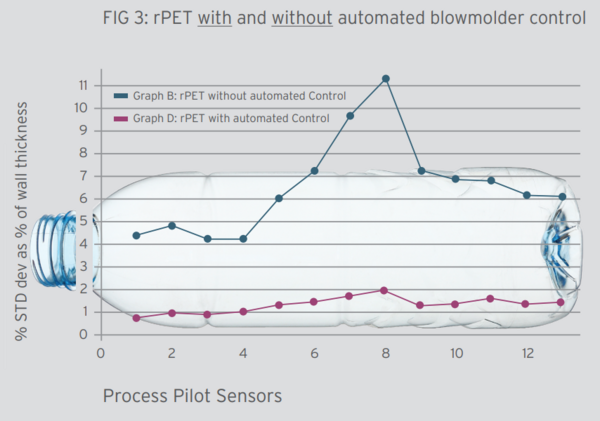
Example D – 50% rPET – automated blowmolder contro
This example represents production runs on similar 500 ml bottle types using preforms manufactured with 50% rPET material managed by the Agr Process Pilot automated blowmolder control system. As with all previous examples, prior to production, the blowmolder recipe was optimized for the bottle size and weight, and bottle distribution baseline was established prior to initiating the Process Pilot automated control system.
Previously shown in example B, processing rPET using manual control exhibited a large amount of variation in material distribution (thickness). Production with automated blowmolder control (Figure 3, graph D) showed a considerable improvement in overall material distribution and represented a much tighter process. In this example, the standard deviation, using automated control to manage the blowmolder ranged between 0.85 to 2.01, an overall range of ~1.5, similar to the results with 100% vPET bottles produced using automated blowmolder control. When comparing to the manual operation of blowmolders producing similar bottles, there is significant improvement in distribution control. See Figure 3 for comparison of with and without the Process Pilot automated blowmolder control.
Comparing vPET vs. rPET production using automated controls
Illustrated in Figure 2, the virgin material, with the control of the blowmolder managed by the Agr system, you can see that the overall material distribution is more consistent and slightly better than an experienced operator. Keep in mind that operator experience skills are relative and can differ from shift to shift and plant to plant affecting production outcomes, whereas this variability is eliminated with automated controls.
When applying automated blowmolder control for the production or bottles with rPET, there is a marked improvement in material distribution standard deviation. This is illustrated in Figure 3. With automated control, the material distribution variability is reduced significantly.
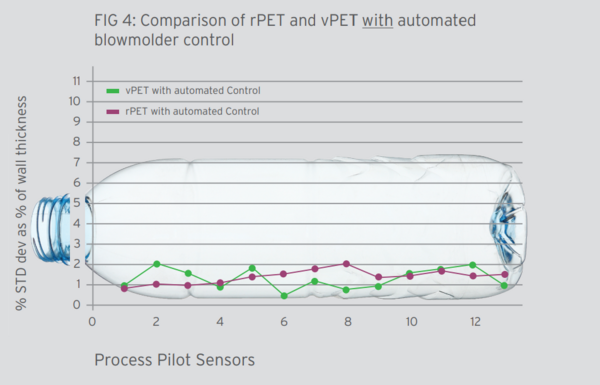
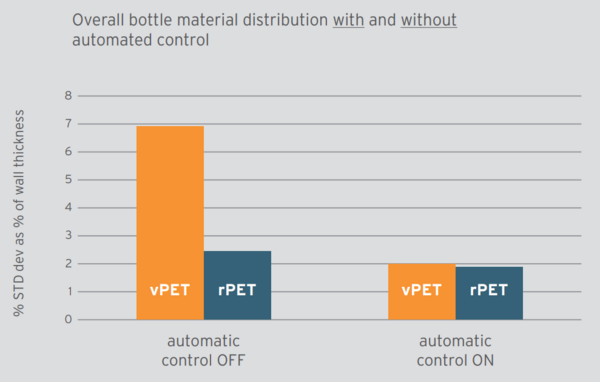
Figure 4 shows the material distribution profiles for rPET and vPET using automated blowmolder control. In comparison, the distribution for the rPET bottles is within the same range as bottles made using 100% vPET material .
Automated blowmolder control is key to successful rPET bottle production
When dealing with random process variability, whether with vPET or rPET, fast response to process changes is important to ensure consistent quality production. Infrequent, after-the-fact section weight analysis for monitoring distribution and manual blowmolder adjustments performed in response to these measurements are not sufficient for high-speed production systems, especially when dealing with rPET. First the infrequency of testing provides plenty of opportunity to miss random process changes that may occur between samples, leaving production gaps where quality can be compromised. Plus, operator changes are not recognized until the next sampling, allowing the potential for additional production of non-conforming bottles and the associated waste.
On the other hand, automated blowmolder control is designed to manage the blowmolder 24/7 to maintain a target material distribution on the finished bottle. With continuous distribution monitoring, process changes can be identified and corrected in real time. Whether they are long-term trends such as might occur with a change in plant temperature, or more random events due to differences in preform batches, these can be monitored and identified quickly. With an automated control system, the blowmolder is automatically adjusted every 20-60 seconds in response to these events to maintain the target material distribution. As a result, material distribution is significantly more consistent throughout the production run.
Why is there such a difference?
Unlike manual control of the blowmolder, where adjustments are made reactively after a noticeable event or following undesirable test results, the Process Pilot automated system is constantly monitoring and adjusting. What this means is as soon the system detects an undesirable trend in material distribution away from baseline, it acts immediately to adjust the appropriate blowmolder controls to bring distribution back to baseline. Minute adjustments are made continuously throughout the production. In the case of rPet, these adjustments are even more significant since variations in color density and IV can affect a small segment of production for a limited time within the production run. In this case, automated controls can react quickly to adjust the blowmolder to compensate for these issues and maintain the distribution baseline.
Conclusion
In spite of the issues associated with rPET material, it is possible to produce quality bottles with minimal waste while still operating efficiently. Producing bottles with up to 100% rPET on a consistent basis can be quite challenging without the proper tools. Tools are now available to manage the quality issues and overcome the processing challenges, all the while improving productivity. With the availability of vision inspection systems like the Agr Pilot Vision+, color issues, contaminants and defects related to rPET can be addressed in the preform stage in particular. In addition, intensive blowmolder oversight necessary to manage changes in material distribution due to rPET and other process variability, can be effectively addressed with an automated blowmolder management system like the Agr Process Pilot. Implementing tools such as these can make the difference between marginal production and bottle quality and successful continuous production that supports maximum uptime and production output. With the everincreasing amount of rPET in use today and its known variabilities, automated management of the process is the best way to maintain a high-quality, stable production.
_______________
/1/ Standard deviation defined as a % of wall thickness (thickness reading by sensor divided by average thickness at sensor)
The comPETence center provides your organisation with a dynamic, cost effective way to promote your products and services.
magazine
Find our premium articles, interviews, reports and more
in 3 issues in 2026.
